

Global Factor Views: Macroeconomics favour Quality and Low Volatility stocks
KEY POINTS
In Europe and the US, inflation is not far from the central banks’ targets but there are signs that economic growth is slowing. US payroll data was weaker than expected in July, raising concerns that macroeconomic conditions may slow more than anticipated, unsettling equity markets.
A backdrop of slowing inflation and softer macro data means that markets expect interest rates to fall as central back attention switches to managing growth and labour market risks.
In addition, the Institute for Supply Management (ISM) New Orders Index declined in July which resulted in the macro indicator on our factor dashboard switching to a ‘deceleration’ phase.
Equity factor outlook
Given the current macro and interest rate backdrop we have updated our Global Factor dashboard – see below:
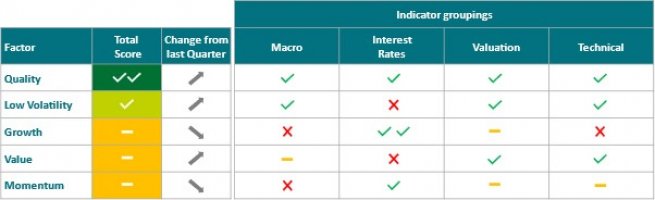
In August, after measuring the macro, interest rates, valuation and technical indicators, the highest ranked factors were found to be Quality and Low Volatility while Value and Momentum were the lowest ranked.
Low Volatility is the most improved factor compared to last quarter - it typically performs well in slowing macro conditions while valuation and technical remain supportive. Momentum has fallen to the bottom of scorecard, though its aggregate score is neutral. Presently few factor scores are at extremes and, for now, there is little difference between the total score for Growth, Value and Momentum.
We set out in detail our outlook for equity market factors below.
Quality: Positive
Our factor dashboard continues to have a positive ranking for Quality. Quality stocks – those with premium levels of profitability - tend to be rewarded when macro sentiment is in a ‘deceleration’ phase of the cycle. Overall, the valuation of Quality is trading at a premium to the average level; however, unlike other factors, Quality’s performance has not historically been sensitive to periods of high valuation. We would recommend an active approach to Quality investing with a focus on forecast Quality which is more adaptive to changing economic conditions.
Low Volatility: Positive
Low Volatility is now positively ranked on our factor dashboard and is the most improved factor compared to last quarter. The improvement has been driven by our macro indicator pillar moving into a deceleration phase of the cycle, which typically favours the Low Volatility factor. While falling interest rates often weigh on the performance of Low Volatility, this is normally due to the cycle moving into a recovery phase, rather than current conditions where rates are falling to manage a growth slowdown. Because Low Volatility has been out of favour recently, its valuation and technical indicators are also supportive.
Growth: Neutral
Growth is neutral-ranked on our factor dashboard. Our macro indicator, which is based on the level and rate of change of the ISM New Orders Index, is now in a deceleration phase of the cycle which, historically, does not tend to favour the Growth factor. This headwind is however tempered by prospects of falling interest rates – something that is typically supportive of Growth. Strong first-half performance for Growth has resulted in the factor becoming ‘crowded’- i.e. very popular - which results in a negative score on technical indicators.
Value: Neutral
Value - stocks which appear to be trading for less than their underlying worth - is also neutral-ranked on our factor dashboard. Slowing macro momentum has not historically been supportive for Value, given the factor exposure to more cyclical parts of the market. Falling interest rates also weigh on the outlook for Value as investors typically favour longer duration growth stocks as rates fall. Value’s valuations, however, are reasonably attractive on some measures, alongside technical factors which are also supportive.
Momentum: Neutral
Price momentum as a factor captures stocks that have a positive price change, relative to the market, over the last 12 months. And Momentum was the highest ranked factor for much of 2023 and the first quarter (Q1) of 2024. Its ranking fell in April after its technical score deteriorated. Specifically, momentum stocks at the end of Q1 were starting to exhibit low levels of performance dispersion, which is an indicator of factor crowding and, historically, a warning signal for the factor.
While the crowding issue has not deteriorated has since April, it remains elevated, and this continues weigh on the factor’s overall score. Furthermore, slowing macro momentum is also typically negative for Momentum and, as such, it has now moved to be the lowest-ranked factor on our dashboard.

Disclaimer
The information on this website is intended for investors domiciled in Switzerland.
AXA Investment Managers Switzerland Ltd (Part of BNP Paribas Group) is not liable for unauthorised use of the website.
This website is for advertising and informational purpose only. The published information and expression of opinions are provided for personal use only. The information, data, figures, opinions, statements, analyses, forecasts, simulations, concepts and other data provided by AXA Investment Managers Switzerland Ltd (Part of BNP Paribas Group) in this document are based on our knowledge and experience at the time of preparation and are subject to change without notice.
AXA Investment Managers Switzerland Ltd (Part of BNP Paribas Group) excludes any warranty (explicit or implicit) for the accuracy, completeness and up-to-dateness of the published information and expressions of opinion. In particular, AXA Investment Managers Switzerland Ltd (Part of BNP Paribas Group) is not obliged to remove information that is no longer up to date or to expressly mark it a such. To the extent that the data contained in this document originates from third parties, AXA Investment Managers Switzerland Ltd (Part of BNP Paribas Group) is not responsible for the accuracy, completeness, up-to-dateness and appropriateness of such data, even if only such data is used that is deemed to be reliable.
The information on the website of AXA Investment Managers Switzerland Ltd (Part of BNP Paribas Group) does not constitute a decision aid for economic, legal, tax or other advisory questions, nor may investment or other decisions be made solely on the basis of this information. Before any investment decision is made, detailed advice should be obtained that is geared to the client's situation.
Past performance or returns are neither a guarantee nor an indicator of the future performance or investment returns. The value and return on an investment is not guaranteed. It can rise and fall and investors may even incur a total loss.
AXA Investment Managers Switzerland Ltd (Part of BNP Paribas Group)
__________________________________________________________________________
AXA IM and BNPP AM are progressively merging and streamlining our legal entities to create a unified structure
AXA Investment Managers joined BNP Paribas Group in July 2025. Following the merger of AXA Investment Managers Paris and BNP PARIBAS ASSET MANAGEMENT Europe and their respective holding companies on December 31, 2025, the combined company now operates under the BNP PARIBAS ASSET MANAGEMENT Europe name.