
European High Yield – Annual Perspectives
- 29 January 2024 (10 min read)
What happened in 2023, and what do we think for 2024?
At the start of last year, we pointed out that yields in our asset class were extremely attractive – 7.96% on the ICE BofA European Currency High Yield Index. Whilst many, including ourselves, had a bearish view of the macroeconomic picture, we still took a great deal of comfort in this figure. Put simply, such high incomes offered a lot of protection against bond prices falling: either due to rates rising; or due to spreads widening. Indeed, had we been writing this outlook piece towards the end of October, we would have felt quite satisfied in pointing out that high yield was on track for a total return very much in line with this starting level. Up to that point in the year, the negative impact from government bonds had been broadly offset by some tightening of spreads. However, once markets began seriously pricing for a pivot in central bank policy, the asset class rallied strongly and ultimately gained over 12%. This marked the best calendar performance since 2012.
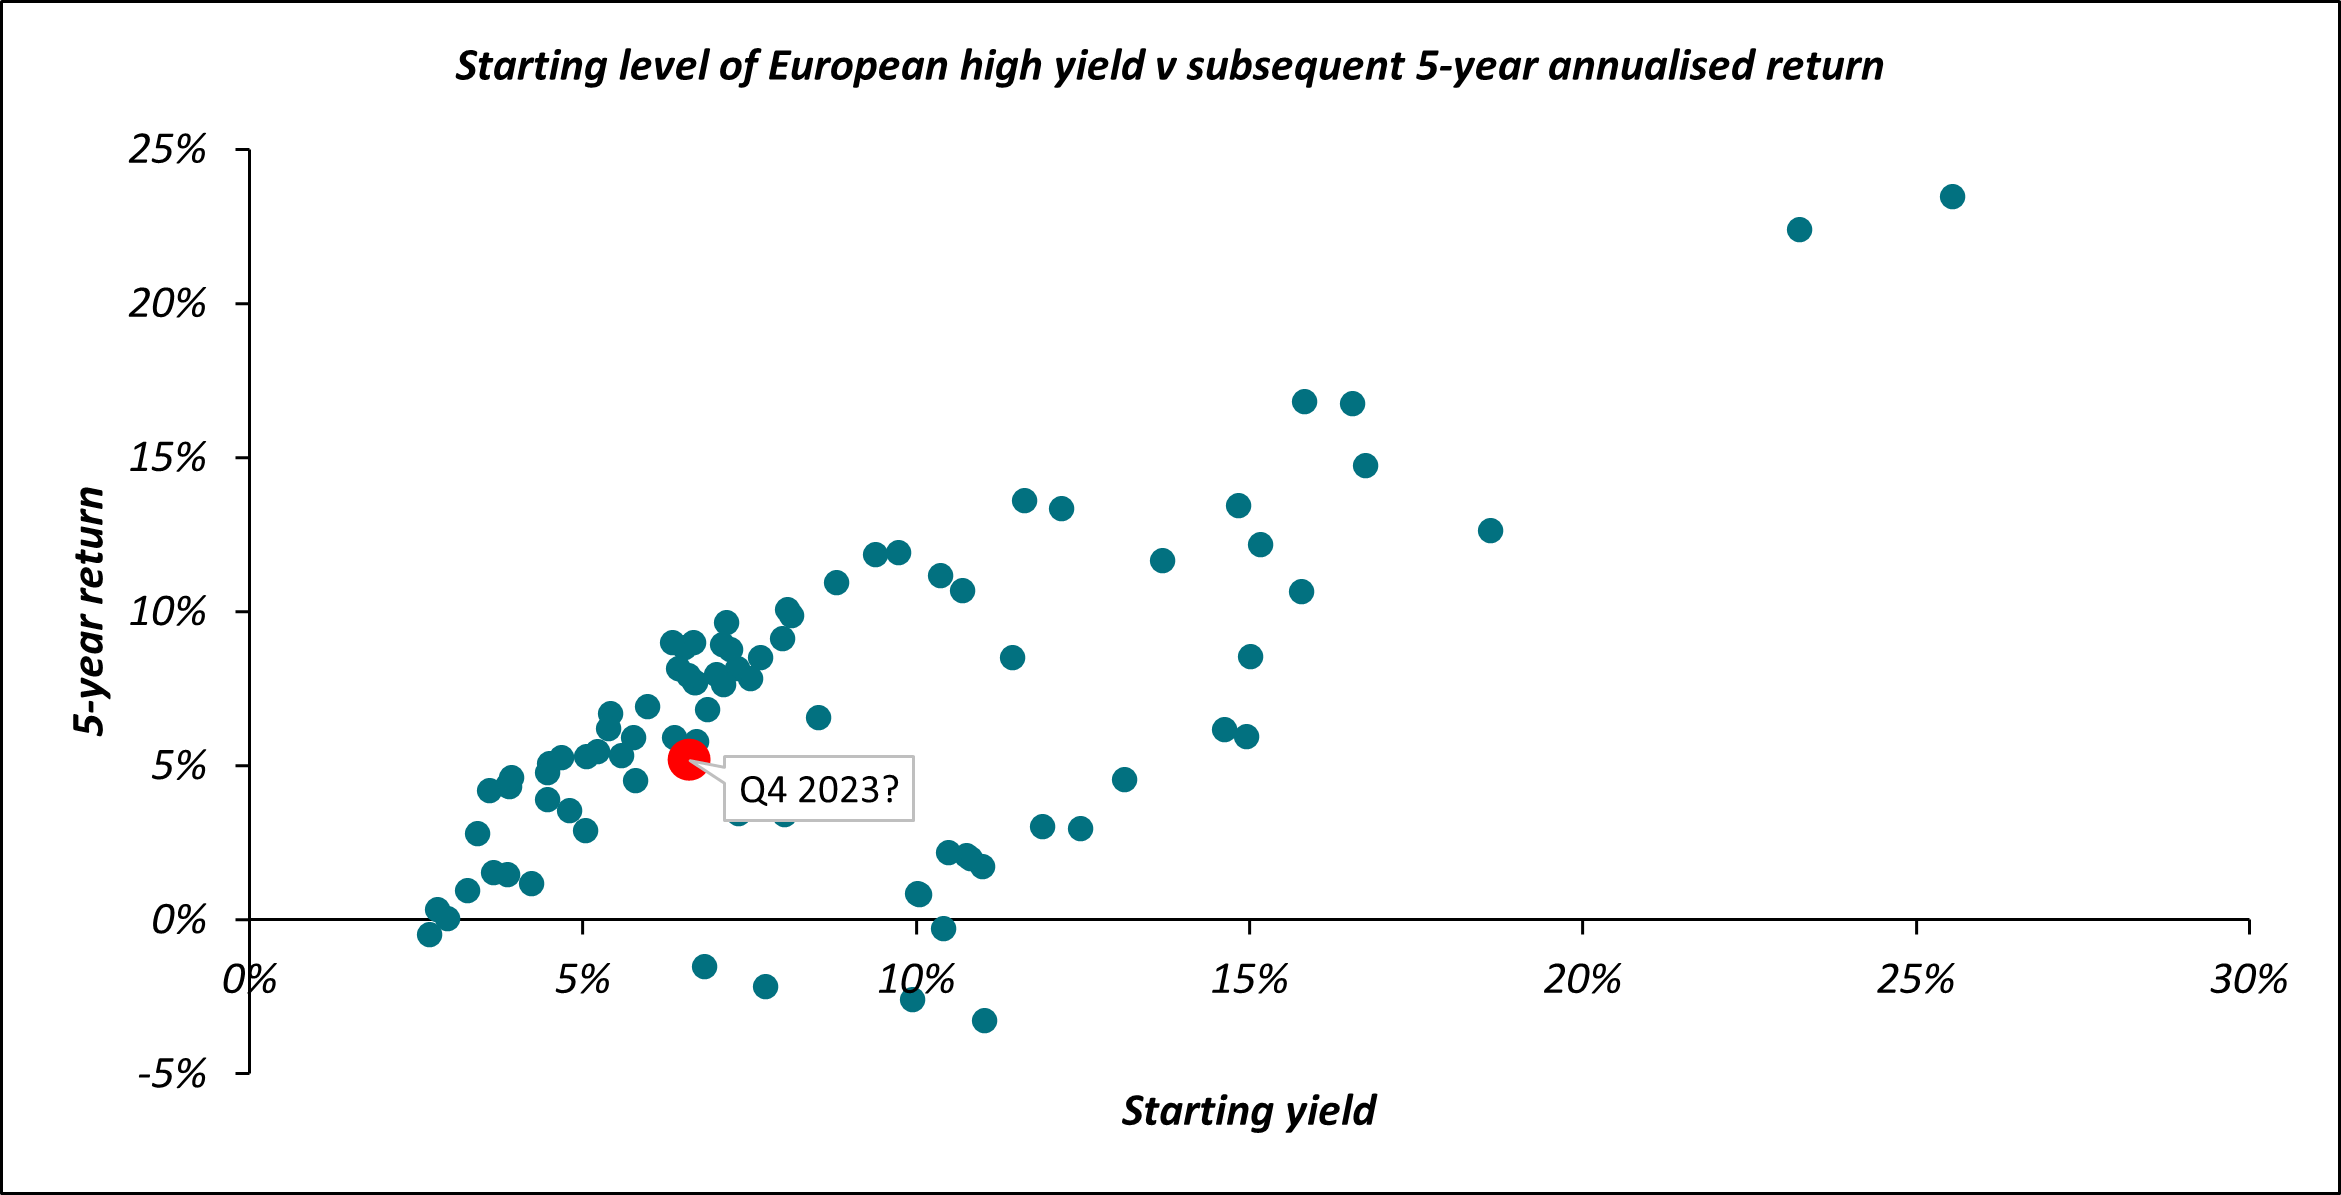
Many market participants remain wary of the downside risk of a recession. Indeed, maybe more so now, given that the cycle is a year longer (and spreads are tighter). But as we write this, yields are still just above 6.5% and, as long-term investors, we can’t help but be reassured by charts such as the below. It takes data for the ICE BofA European Currency High Yield Index for all quarters since its inception in 1997. It then considers annualised returns over a rolling 5-year period and looks at what the yield was at the start of that term. Encouragingly, and unsurprisingly, when incomes are strong, subsequent performance tends to be as well.
Source: AXA IM/Bloomberg; refers to the ICE BofA European Currency High Yield Index as of 31st December 2023
But back to the shorter term and, broadly speaking, we see three possible paths for the economy this year:
- Central bankers achieve their much-vaunted soft-landing, and the major economies suffer at worst a mild recession. Whilst this is likely most people’s base case (and ours), at the end of 2023 markets rapidly moved to price this scenario (including a full 150bps of interest rate cust in both the US and Europe). Put another way, some of the return we might have expected to achieve this year was already earned in November and December. In the absence of negative catalysts , spreads may well grind tighter – supplementing the carry to produce another strong year. But risks are certainly now more evenly balanced than they were, should data begin to threaten investors’ soft-landing expectations
- Markets are wrong and inflation is not yet fully under control – necessitating further interest rate rises. In such a scenario, high yield would be afforded protection by its relatively short duration, and the healthy levels of income. Returns would look something akin to the first three quarters of this year – that is, broadly in-line with the starting yield – albeit with some reversal of the recent, year-end price-gains
- The sheer scale and pace of rate hikes enacted over the last two years is finally brought to bear on markets, resulting in a deeper recession. We will explore this downside scenario more below but, essentially, in our opinion even this situation would be manageable for the asset class
In all three cases, our central message remains the same – current valuations, though less attractive than they were, still represent a reasonable entry point for European high yield.
Yields are indeed high, but what about spreads?
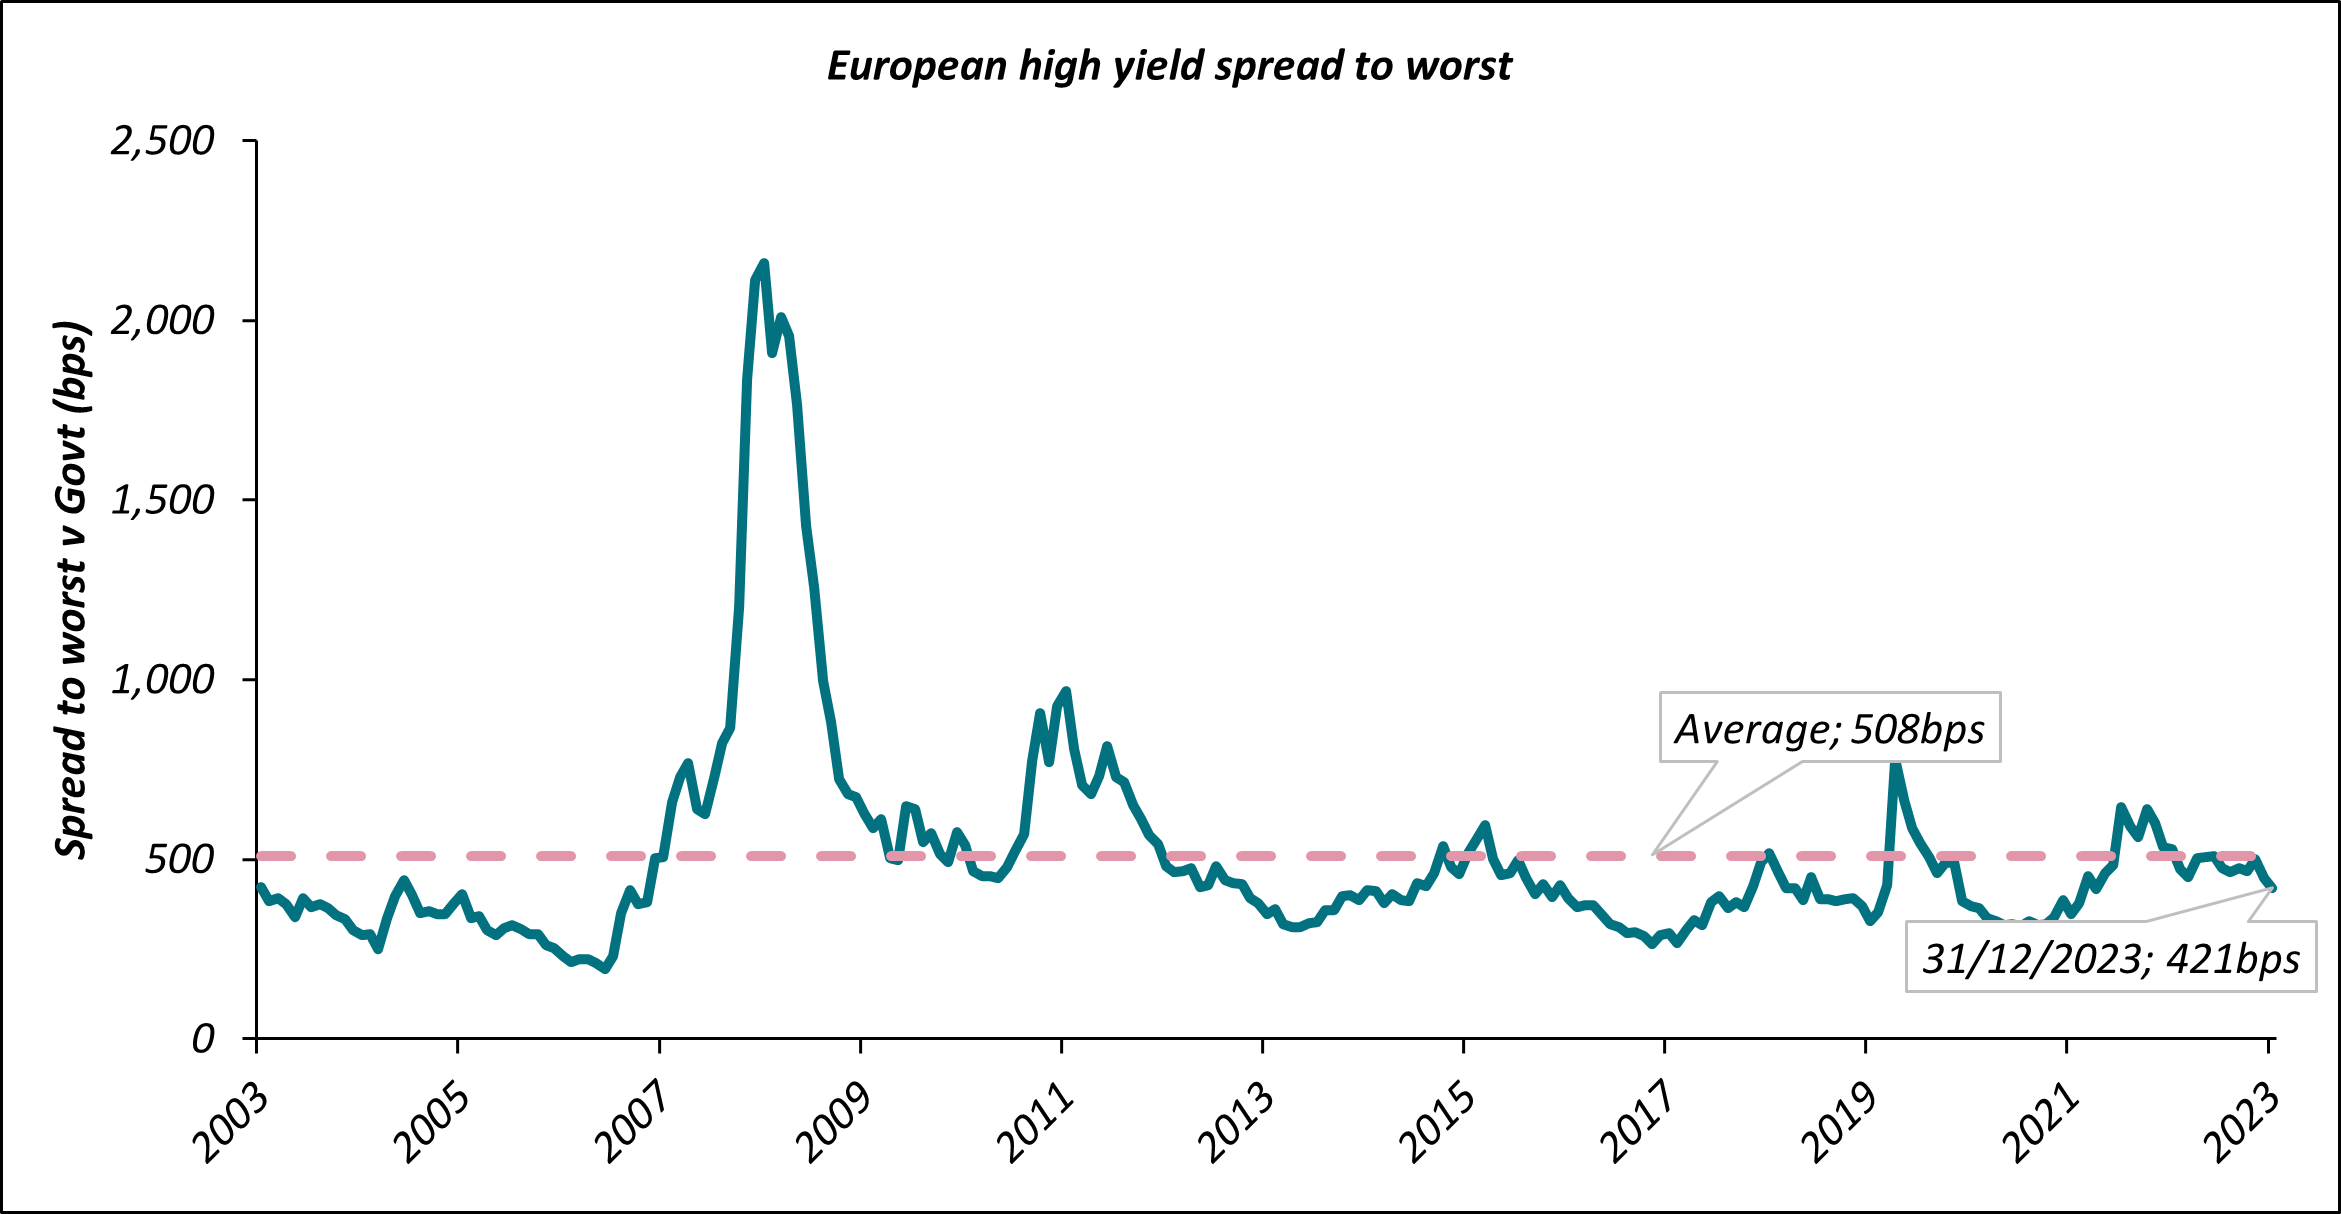
One common refrain is that, though all-in yields are lofty, spreads are not particularly generous. The chart below would appear to support this idea, given that we are inside the average historical level.
Source: AXA IM/Bloomberg; refers to the ICE BofA European Currency High Yield Index as of 31st December 2023
However, we would argue that there are a few key caveats to point out:
- European high yield is a higher quality asset class today than it ever has been in the past – whether assessed by the median credit rating, or the proportion of CCCs. That is to say, market participants are currently being paid slightly below average spreads for much lower-than-average credit risk
- Similarly, the index has historically low duration: both modified duration and spread duration. This is a natural consequence of higher yields – over the last two years, companies have preferred to leave their lower-coupon debt outstanding for longer. The result for us is that, again, there is less interest rate and spread sensitivity than in the past
- Rolling both of these together and trying to quantify it… breakevens are actually quite healthy. A simplified calculation suggests we’d need to see spreads widen by around 150bps to eliminate the excess carry. Such a widening would be short of what we would expect in a full-blown recession, but would still represent a pretty notable correction
Of course, all of the above deal with averages at the index level. One of the features of the last year has been the significant divergence between ratings cohorts and between individual bonds. Even in a strong year, the weakest of these have badly underperformed: for example, in 2023 Bs returned +15.3% - whilst CCCs managed only +5.7%. Similarly, Real Estate bonds managed to end the year down -0.6%.
We expect such idiosyncrasies to persist, and for individual credit stories to dominate. Indeed, it’s the final reason why we feel comfortable with one of the sources of potential losses – defaults.
Hang on… surely default rates will rise?
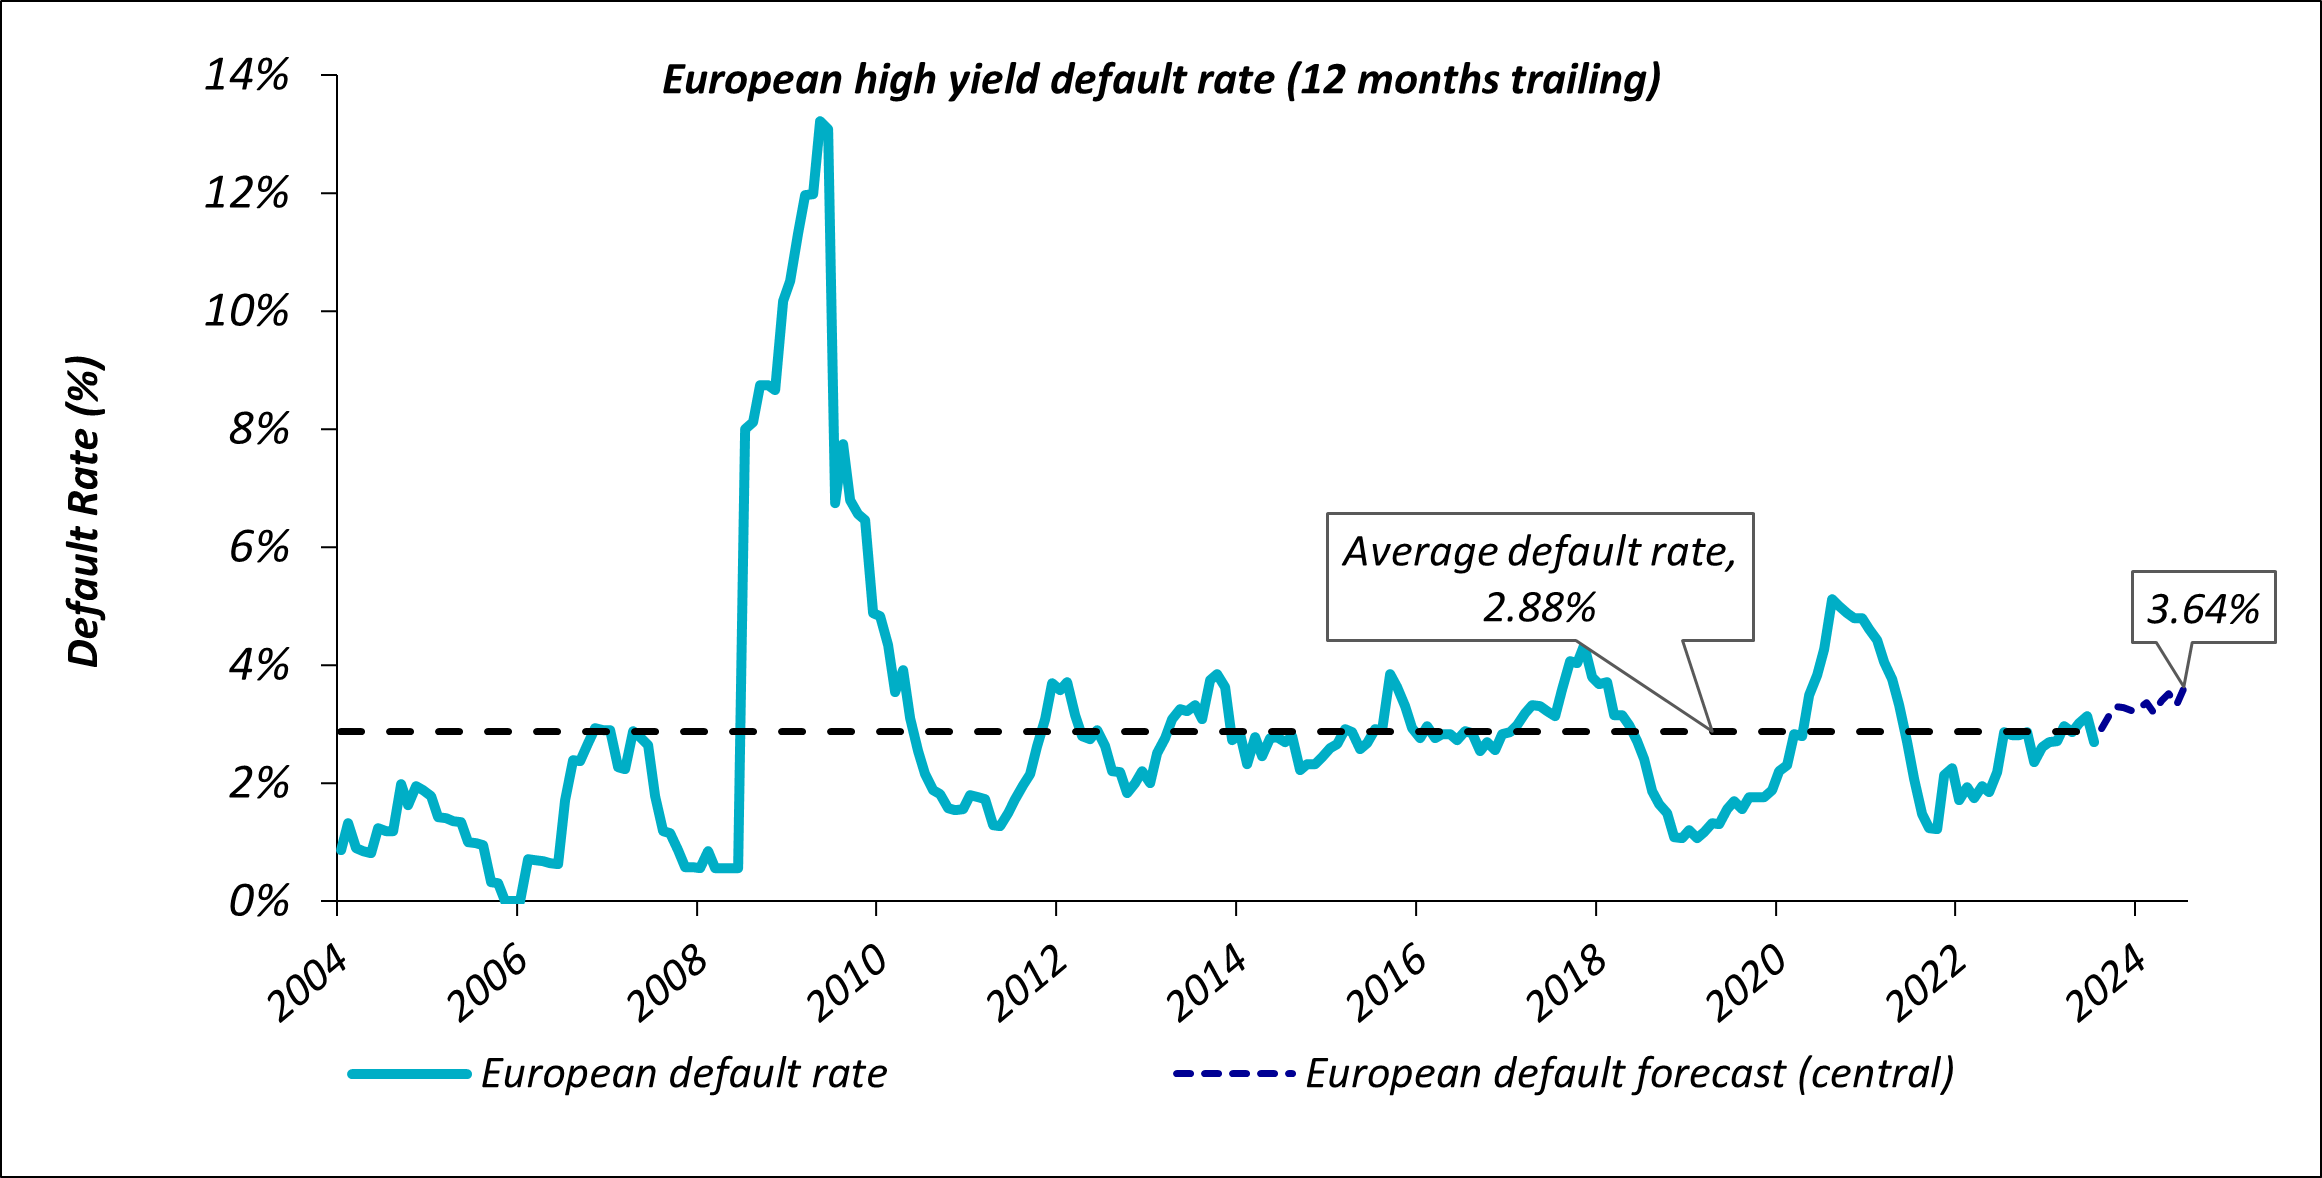
Indeed they will, and probably as soon as this year. Still, Moody’s only expects default rates to rise from 2.9% to 3.6% - a little above the long term average, but certainly not a big spike.
Source: Default data from Moody’s as of October 2023. Historical data is shown since December 2003
Source: JP Morgan as of 30th June 2023
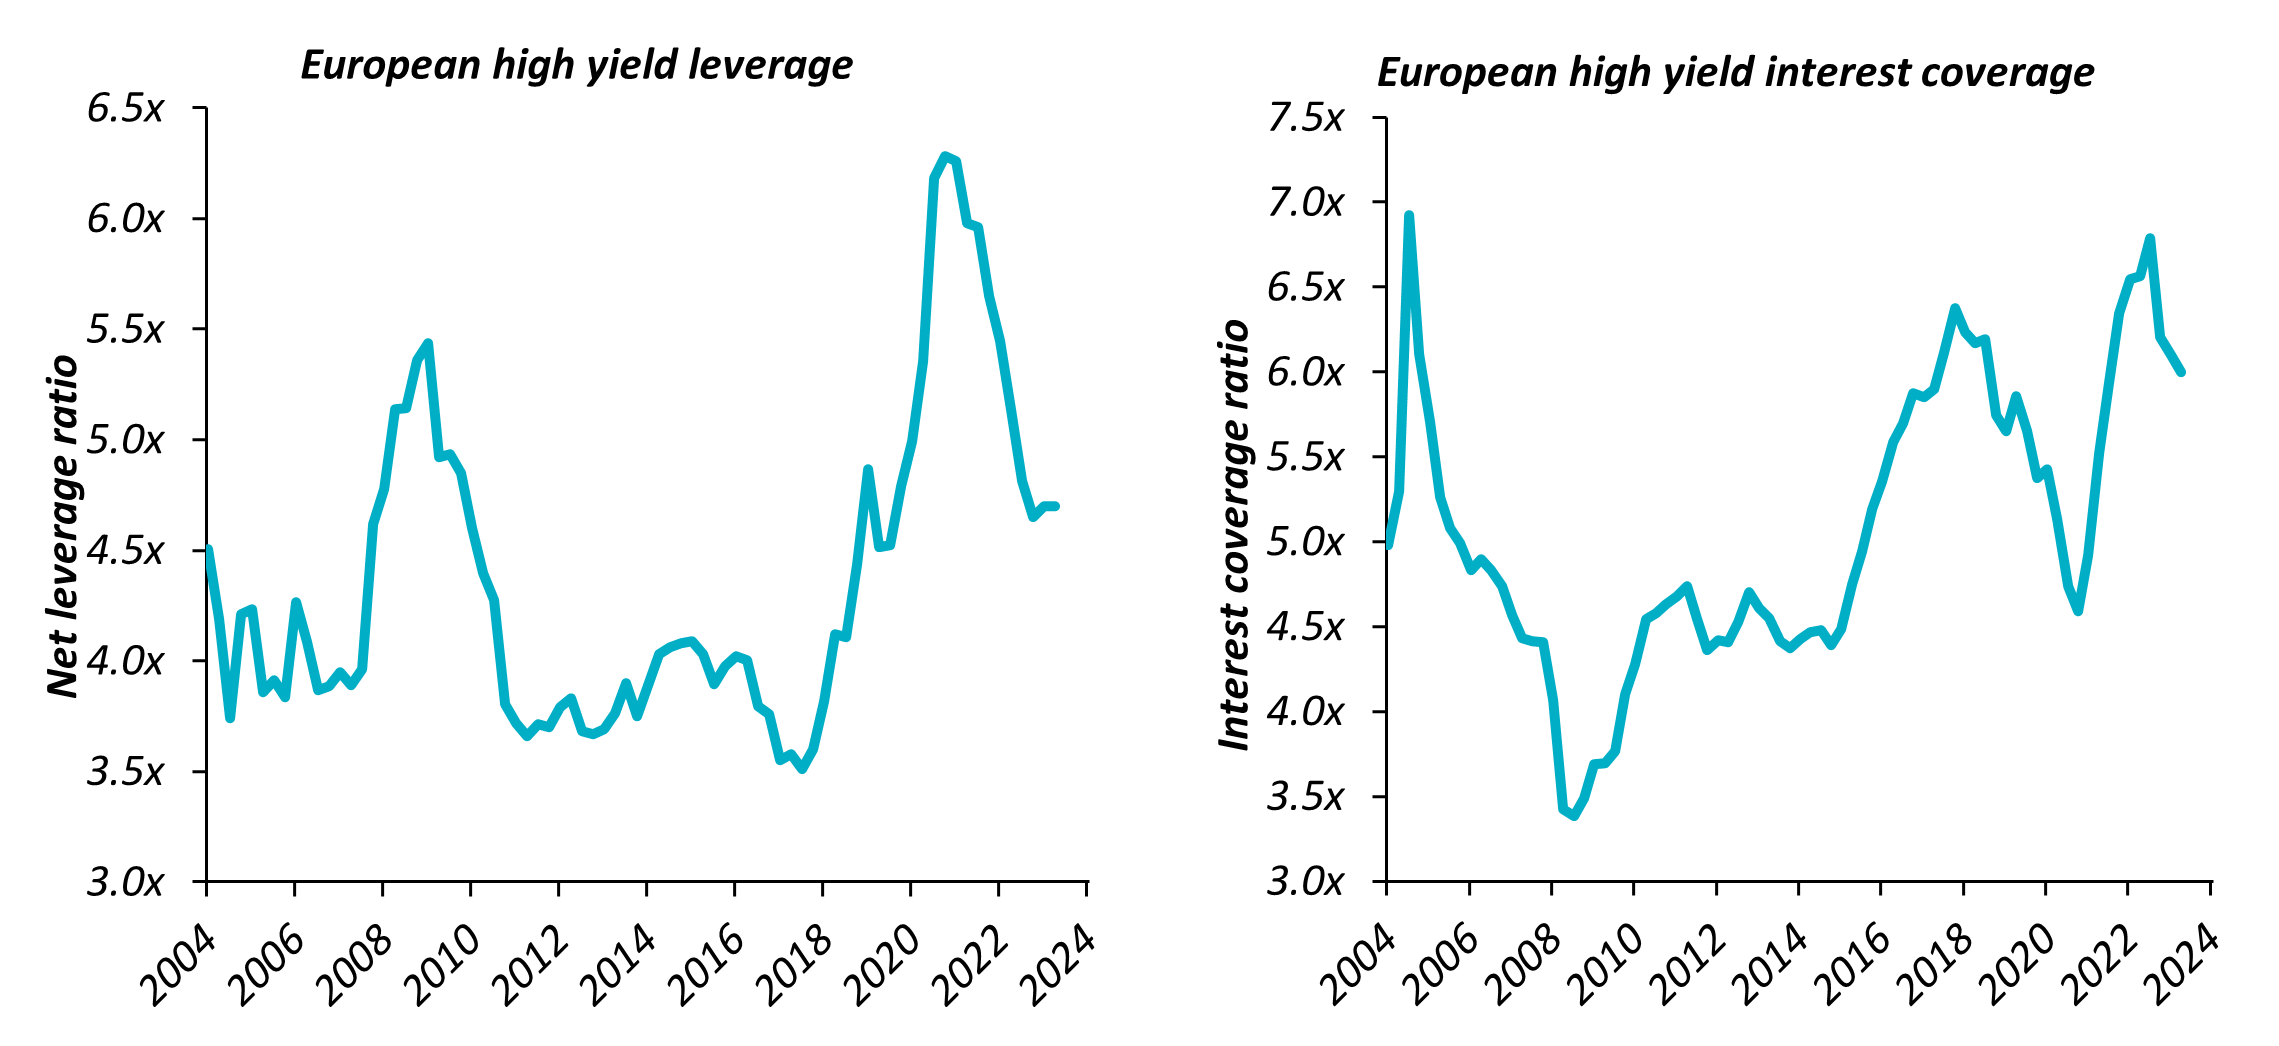
We can be so sanguine because we just do not think that index-level fundamentals (above) are showing any great stresses. Leverage and interest coverage ratios, two of our key metrics, have taken a small turn for the worse… but a very muted one, and this on the back of decent improvements over the last few years. This deterioration will likely continue, as higher funding costs begin to be fully reflected. But one of the great advantages of such a “long expected” slowdown has been that companies have been able to spend over a year now preparing and using the time to get their balance sheets in order. Exceptional inflationary profits have been used to reduce debt, non-core assets have been sold and capex has been reduced – all whilst shareholder payouts have been kept to a minimum. This is exactly what bondholders like to see and means that we can find plenty of credits who will have no problems navigating the next phase of the cycle.
Instead, the rise in defaults will be driven by a much smaller number of names who have been unable or unwilling to take the actions above, or who find themselves in a uniquely challenging situation. For these companies, 2024 may well prove to be the crunch point.
Here comes the 2025 maturity wall…
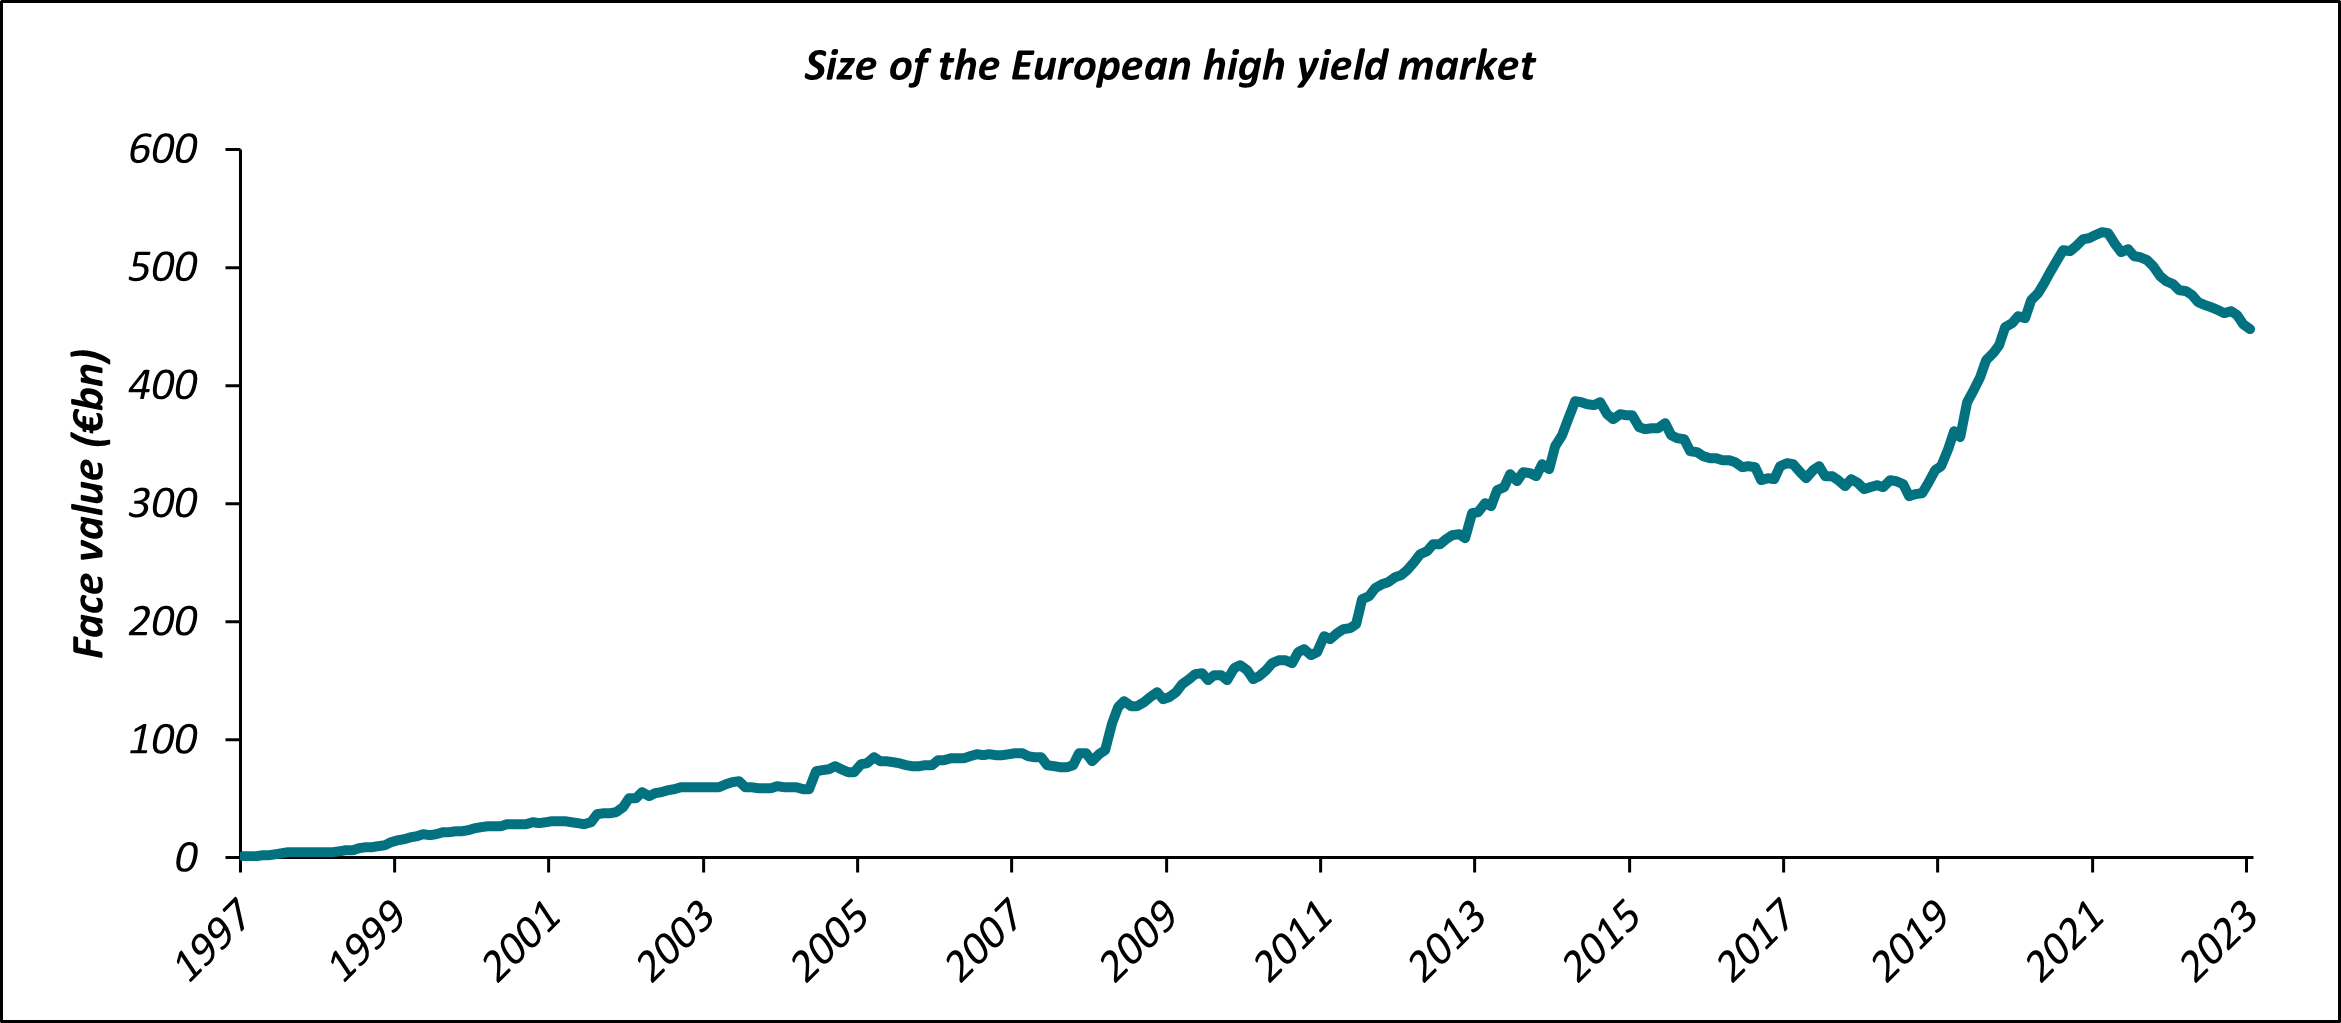
One chart we’ve been great fans of this year has been this one below. It shows the total size of the European High Yield market, and is an excellent explanation of why returns have been so strong.
Source: AXA IM/Bloomberg; refers to the ICE BofA European Currency High Yield Index as of 31st December 2023
Our market has been shrinking for almost two years now. It is about 15% smaller than its peak in March 2022. As mentioned above, companies have been using this time to shore up their balance sheets – in many cases, by paying down debt. And LBO activity, historically a contributor to net supply, has been muted. It has also been a good environment for rising stars, with a few large capital structures leaving the index (Ford being the latest example in October). The result has left investors chasing fewer bonds, an extremely favourable source of technical support for spreads – and one which we expect to continue through 2024.
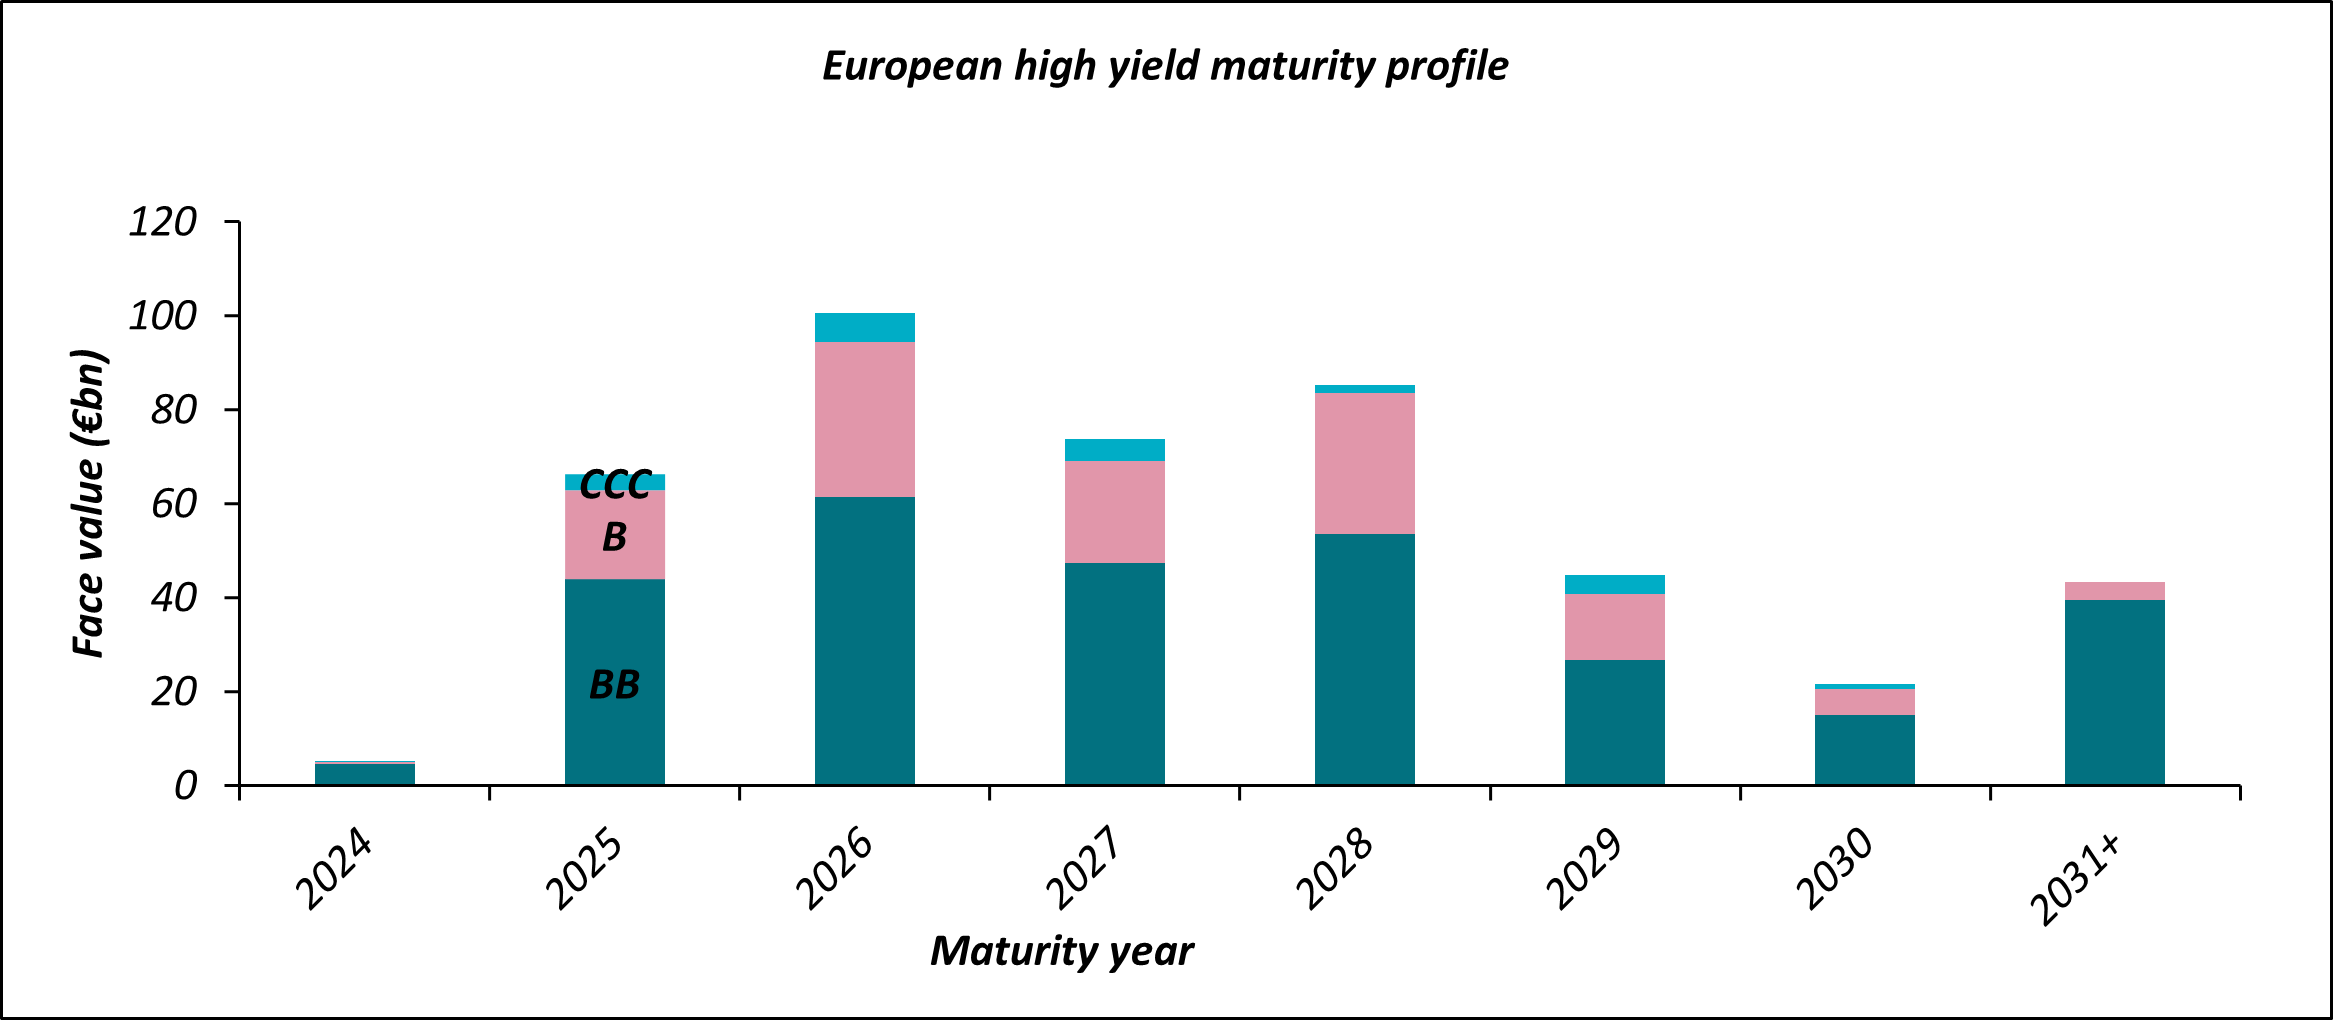
However, the flip-side of such conditions for investors is that borrowers’ ability to issue new bonds is diminished. This was not too much of an issue in 2023, since many high yield companies used the buoyant primary markets of 2020 and 2021 to push out their debt to 2025 (and beyond). But rating agencies’ desire to see borrowers refinance their notes a year before maturity means that 2024 is the year when they will have to roll-over this paper.
Source: AXA IM/Bloomberg; refers to the ICE BofA European Currency High Yield Index as of 31st December 2023
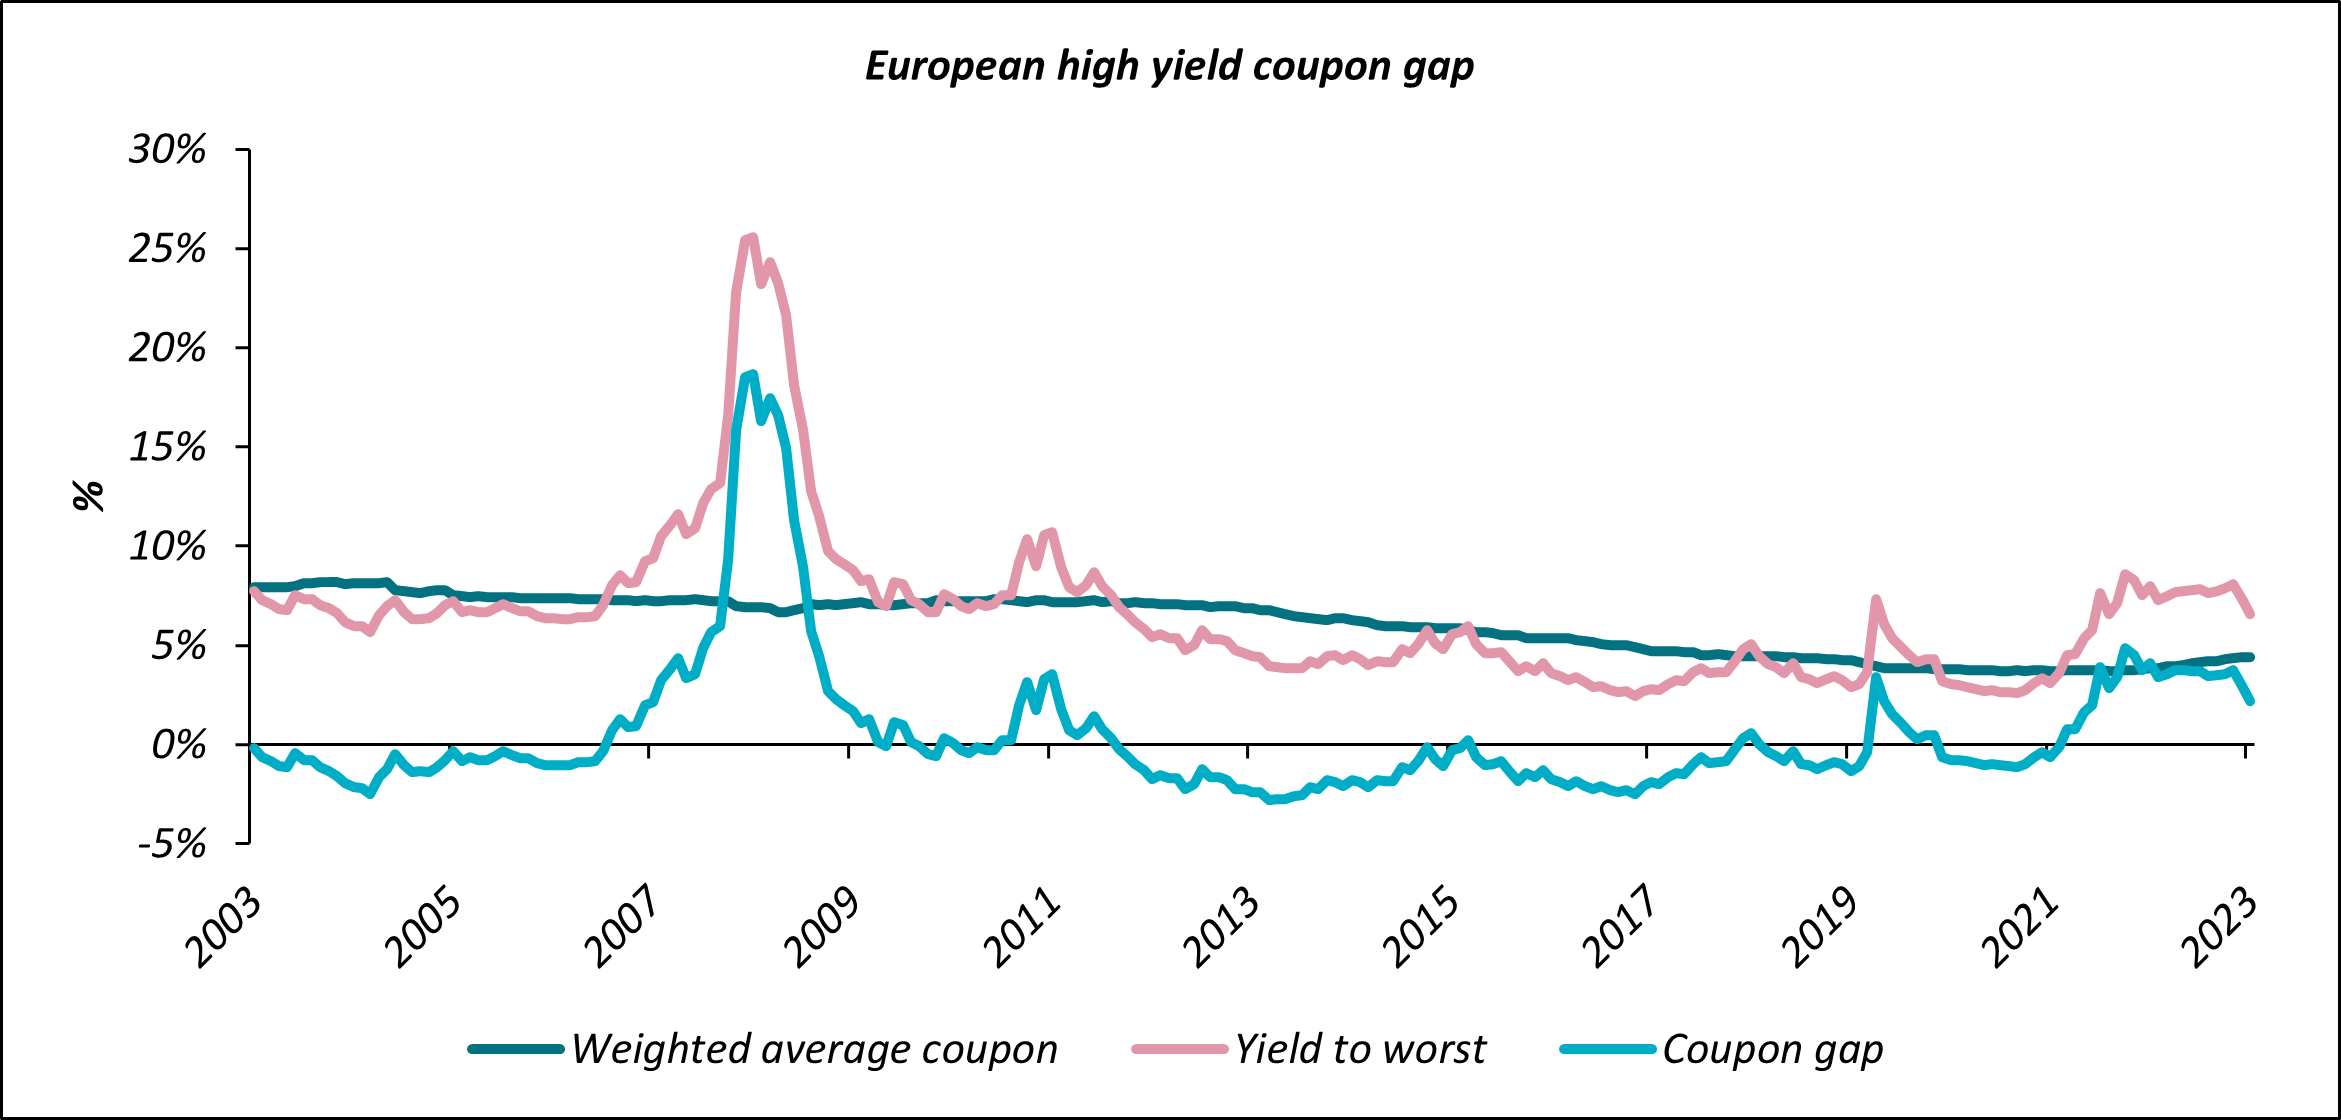
Further, they will be doing so at a particularly inauspicious time – when the “coupon gap” (the difference between their old coupons and their likely new ones) is still almost as high as it’s been outside of periods of extreme market stress.
Source: AXA IM/Bloomberg; refers to the ICE BofA European Currency High Yield Index as of 31st December 2023
However, we caution against seeing too much despair in these two charts. As can be seen from the top one, BBs (and strong Bs) make up the vast majority of the upcoming maturities. Undoubtedly, there will be issuers whose business models simply do not work with such expensive interest costs, and who have exhausted all other financing possibilities. It is these situations which will push the default rate higher, as discussed above. But most companies do have options: either for a straight refinance, an amend-and-extend-type deal, or for other, more creative solutions (such as direct lending). And it’s worth pointing out that one positive aspect of the recent rally has been that more credits now fall into this latter category. That is, the small reduction in yields visible on the chart above may well prove to be the difference between a capital structure that is able to be refinanced – and one that is not. Whilst we remain very cautious around investing in names whose balance sheets do not stand up to rigorous stressing, there are undoubtedly likely to be some interesting opportunities in good credits whose prospects now look even brighter.
Risk v reward
And so we suggest it is this balance of risks and opportunities that continues to make European high yield look an interesting proposition into 2024. We still retain some caution, and our preference is to be defensively positioned: that is, a core holding of strong BBs, supplemented by high conviction Bs with a compelling risk-reward.
Clearly, valuations appear less generous than they were at the end of October. And with a particularly bearish view of the world, other asset classes offer greater protection against any downside - but the same argument also applied a year ago. There is a possibility that, as then, to focus solely on the negatives is to risk missing out on another year of healthy returns.
The case for a short duration strategy
We also continue to particularly like the front-end. Such a position is an excellent way to gain exposure to European high yield, but with a significantly lower potential for drawdowns and for ongoing volatility. Inverted government bond curves, and relatively flat spread curves, mean that such a strategy can capture most of the yield on the index, but for much less of the uncertainty – whether measured by modified or by spread duration These defensive characteristics have only become more attractive as markets have tightened, and risks have become more skewed to the downside.
Disclaimer
The information on this website is intended for investors domiciled in Switzerland.
AXA Investment Managers Switzerland Ltd (AXA IM) is not liable for unauthorised use of the website.
This website is for advertising and informational purpose only. The published information and expression of opinions are provided for personal use only. The information, data, figures, opinions, statements, analyses, forecasts, simulations, concepts and other data provided by AXA IM in this document are based on our knowledge and experience at the time of preparation and are subject to change without notice.
AXA IM excludes any warranty (explicit or implicit) for the accuracy, completeness and up-to-dateness of the published information and expressions of opinion. In particular, AXA IM is not obliged to remove information that is no longer up to date or to expressly mark it a such. To the extent that the data contained in this document originates from third parties, AXA IM is not responsible for the accuracy, completeness, up-to-dateness and appropriateness of such data, even if only such data is used that is deemed to be reliable.
The information on the website of AXA IM does not constitute a decision aid for economic, legal, tax or other advisory questions, nor may investment or other decisions be made solely on the basis of this information. Before any investment decision is made, detailed advice should be obtained that is geared to the client's situation.
Past performance or returns are neither a guarantee nor an indicator of the future performance or investment returns. The value and return on an investment is not guaranteed. It can rise and fall and investors may even incur a total loss.
AXA Investment Managers Switzerland Ltd.


